Many of you may be familiar with the Sencha Charting package that comes with Sencha Ext JS. It allows you to quickly create great visualizations such as 3D Column Charts or 3D Pie Charts. However, charts are often not enough for your web applications, and you may need to create a flowchart, seat map, schematic, or even an interactive animation in your app.
Of course, you can use the HTML5 Canvas or SVG directly, but those often lead to issues with cross-platform compatibility. Dealing with browser issues, differences across regular vs: retina displays, animations, etc. is not an easy task. You may also be able to use third party libraries that support multiple renderers and provide some useful abstractions, but quickly, you’ll find yourself spending time dealing with integration concerns across libraries.
Ext JS Charts comes with a drawing package that allows you to create arbitrary graphics and animations without worrying about which technology a particular browser uses for rendering. It automatically selects the most appropriate renderer (Canvas, SVG, or VML) depending on your browser. Under the hood, the draw package follows HTML5 Canvas as the underlying API model. Canvas API calls are automatically translated to SVG or VML as required.
Let’s explore the draw package’s many features and how they have been implemented while you say goodbye to cross-browser compatibility issues!
A Simple Sprite
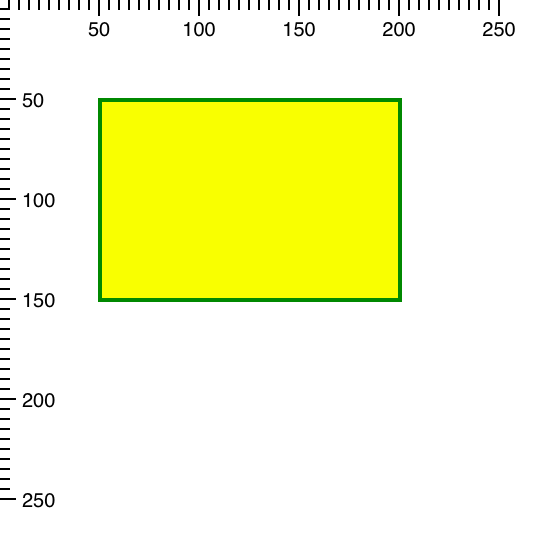
A sprite is a basic primitive that represents a graphical object that can be drawn. You can create a desired image by combining multiple sprites. There are many kinds of sprites available in the Draw package. Each sprite type has various attributes that define how it should be represented. For example, this is a rectangle sprite:
{
    xtype: 'draw',
    width: 250,
    height: 250,
    sprites: [{
        type: 'rect',
        x: 50,
        y: 50,
        width: 100,
        height: 100,
        lineWidth: 4,
        strokeStyle: 'green',
        fillStyle: 'yellow'
    }]

}
Here the "type: ‘rect’“ corresponds with the sprite’s alias, and the rest of the config properties are sprite attributes. It’s important to note that sprite attributes are not configs. You’ll find out more about the differences between attributes and configs in later in this series. For now, let’s just say they are processed and used differently.
The Draw Container
The enclosing ‘draw’ xtype in the previous example corresponds with the Ext.draw.Container class. This is the container of the draw surfaces (instances of the Ext.draw.Surface in which sprites are rendered.
Notice how we used the ‘sprites’ config and not the ‘items’ config of the draw container to add a ‘rect’ sprite to it. This is because ‘items’ of the draw container are its surfaces. The sprites defined in the ‘sprites’ config go into the default ‘main’ surface. You can make a sprite go to a surface other than default if you use sprite’s ‘surface’ config (not an attribute). For example:
{
    type: 'rect',
    surface: 'privateSurface',
    x: 50,
    y: 50,
    width: 100,
    height: 100,
    ...
}
The above will create a surface with ID ‘privateSurface’ and the rect sprite will be placed inside instead of the otherwise default ‘main’ surface. The ‘surface’ config may also be an actual surface instance, which means you would add sprites via ‘setSprites’ method after the draw container has been instantiated.
Note: ‘setSprites’ won’t remove sprites that were already added by the initial ‘sprites’ config or by previous calls to ‘setSprites’. It will only add new sprites. This is because the ‘sprites’ config is meant to be used declaratively. If you need to manipulate sprites, you can do this using surface methods.
Using Multiple Surfaces
The ability to have multiple surfaces is useful for performance (and battery life) reasons. Because sprite attribute changes cause the whole surface and its sprites to re-render, it’s best to group sprites by surface. This means changes to one group of sprites will only trigger the surface they are in to re-render. The Sencha Chart package, which is built on top of the Draw package, heavily relies on this feature. If you have something like a cross zoom interaction in your chart, only the surface used to render the zoom rectangle repaints as you make a selection. This prevents the series and axes surfaces from being repainted, which economizes performance.
We can also rewrite the example above to be more granular. This will allow us to better understand the moving parts:
var drawContainer = new Ext.draw.Container({
    renderTo: document.body,
    width: 250,
    height: 250
});

var mainSurface = drawContainer.getSurface(); // --- getSurface('main')

mainSurface.add({ // add sprite to the surface
    type: 'rect',
    x: 50,
    y: 50,
    width: 100,
    height: 100,
    lineWidth: 4,
    strokeStyle: 'green',
    fillStyle: 'yellow'
});

mainSurface.renderFrame(); // --- renders all the sprites in the surfaceModifying Sprite Attributes
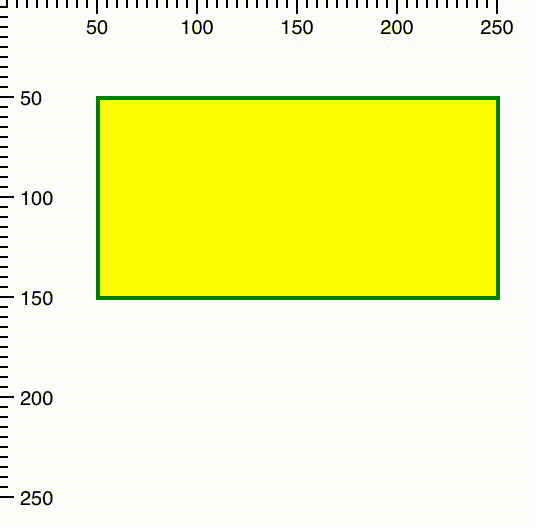
Next, let’s have a look at how to modify a sprite’s attributes. For example, we can make our ‘rect’ sprite more rectangular by making it wider.
First, we need to get a reference to our sprite. One way to do that is to get the ‘items’ config of the surface, which is an array of all the sprites that belong to said surface:
var items = mainSurface.getItems(),
    rectSprite = items[0];
Alternatively, we can use the surface’s get method:
var rectSprite = mainSurface.get(0);Lastly, we can assign an ID to our sprite and then get by said ID:
mainSurface.add({
    type: 'rect',
    id: 'myRect',
    ...
});

var rectSprite = mainSurface.get('myRect');
Now we can change the sprite’s width. This is how we do it:
rectSprite.setAttributes({
    width: 150
});

// --- Repaint the surface after changing sprite's attributes

mainSurface.renderFrame();
Notice that we can’t use ‘rectSprite.setWidth(150);’ because ‘width’ is not a config.
We can also set more than one attribute at once, which is best for performance efficiency. Let’s change the colors of both fill and stroke in one fell swoop:
rectSprite.setAttributes({
    fillStyle: 'rgba(255, 0, 0, .5)',
    strokeStyle: 'rgb(0, 0, 0)'
});
Note: To maximize ease of animation, it’s best to use CSS compliant rgb functions to specify color values containing an alpha, or opacity value, instead of named colors, like ‘white’ or ‘fuscia’ along with the globalAlpha, fillOpacity, and strokeOpacity configs.

Try changing other attributes too and see how it affects the sprite. You can refer to the Ext JS docs to see supported attributes.
Conclusion
As you can see, using sprites is not much different than using components. The same principles are used with sprites. Instead of dealing with HTML directly, the component-like approach saves you time by not forcing you to deal directly with SVG elements and Canvas API calls. You simply create sprites and configure the attributes, and the Draw package takes care of the rest.
In part two of this series, we’ll learn how to animate, transform, and interact with sprites. This includes methods and approaches for creating your own sprites. We will also cover special sprite features such as ‘instancing’ and ‘composites’, which help improve performance and reduce code complexity.
In the meantime, we hope you have fun trying out different types of sprites such as circle, line, or text, which are available in the drawing package.